Big data workflow#
Working with big data efficiently presents a major challenge to analysts. In particular, working with large datasets can use large amounts of computational resource, which can be very expensive. Inefficient code or working practices can unnecessarily increase the costs of running your analysis, as well as the time it takes you to run your code. However, there are good practices that can be employed to help minimise costs without sacrificing the quality of your analysis. We have produced this page as a general guide to best practice in working with big data, including tips for general workflow and managing pipeline development, working with samples and subsets of your data, and optimising analysis with Spark.
General workflow and project planning#
1. Plan your analysis#
A simplified version of the process of developing a new pipeline might look something like this:
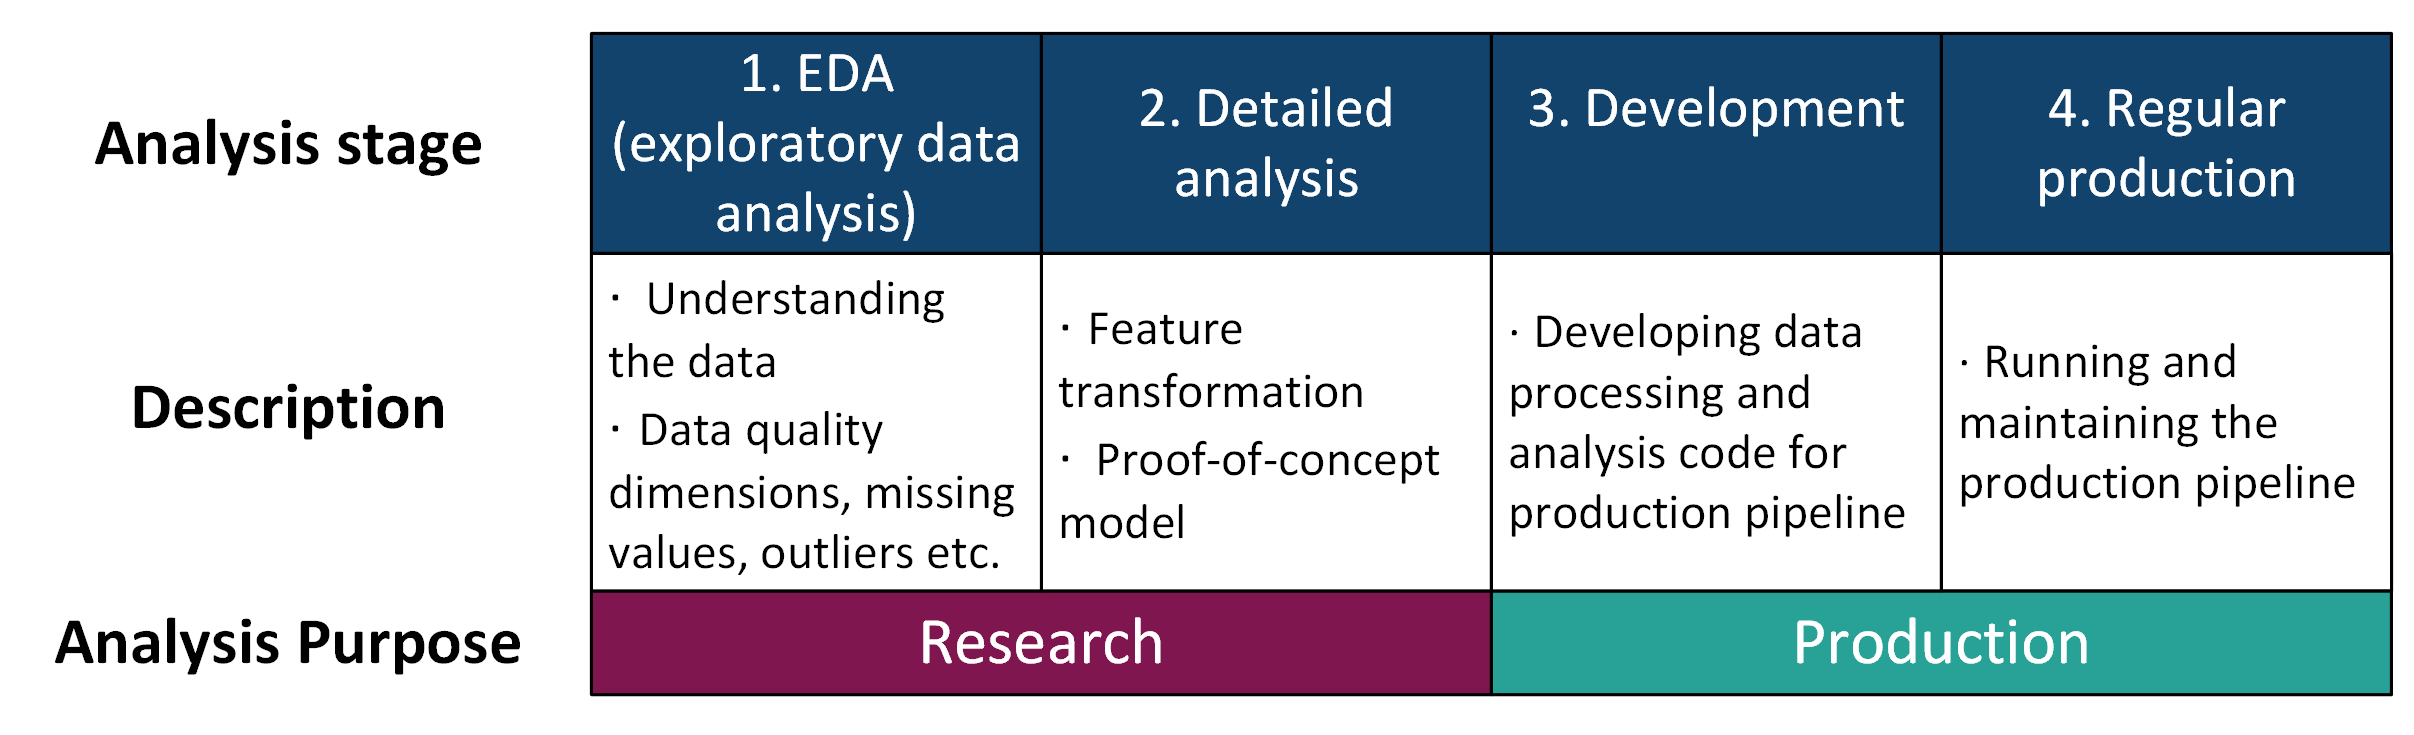
Fig. 40 Big data pipeline development stages#
Splitting your development into clearly defined stages like this will help with applying some of the tips we have below for keeping your resource use to a minimum. For example, working with small samples or subsets of your data in the EDA, detailed analysis and development phases.
2. Version control your code using Git and apply RAP good practice#
This will make it easier to track what has and hasn’t already been done and for others to understand what your code is doing.
It is a good idea to agree on a coding plan including code style for the project and Git branch strategies in advance.
Ensure code is readable, well documented, and follows a logical structure.
3. Use code reviews#
Peer review of code should be used to quality assure and improve your code. A fresh pair of eyes may also be able to spot places where things could be done more efficiently to save computing resource.
This also helps other members of your team understand the code in detail and can help build capability in the team. It is important to avoid situations where a single developer is relied upon to understand, write and maintain all code as this can cause major problems if that person is away or leaves the team.
Data exploration and quality#
4. Be aware of the size of your dataset#
How many rows and columns does your dataset have?
If the dataset is relatively small (less than a few million rows) use Python or R for analysis instead of PySpark or SparklyR.
Consider also switching to using Python or R at points in your pipeline where data becomes small due to filtering or aggregation to save resource. See the ‘When to use Spark’ page of this book for more information.
Is the size of the data likely to grow over time? If this is the case you should consider how you will minimise resource use as the amount of data to process increases.
5. Reduce the size of your dataset to use fewer compute resources#
Generally, it is unnecessary and not good practice to carry out the majority of the analysis stages outlined in the figure above on a full dataset, especially if it is very large.
Keep the size of your data in the EDA, detailed analysis and development stages as small as possible to conserve resource.
Consider taking samples of your data, especially in the EDA phase.
Use a simple sample size calculator to estimate the size of the sample to take.
Ideally, you should take a sample small enough that you can use Python or R for analysis instead of PySpark/SparklyR.
You can validate your sample by comparing descriptive statistics to the full dataset.
Aggregate data where possible.
This can be done in any stage of analysis and may even form part of your regular production pipeline.
You can also use aggregation to help find edge cases that might not be captured by sampling your data. This can be particularly useful in the EDA phase to ensure that these extreme cases are not missed in the development of your pipeline.
Consider what data you really need and filter this out as early as possible to reduce the size of your data.
6. Consider creating synthetic data to work on#
Create minimal size dummy data containing edge cases to work with in the development phase.
The Faker package for Python and fakeR package for R can be used to generate synthetic data for you to use.
Synthetic datasets can also be used for testing or peer reviewing code to help QA either code or analysis.
The diagram below has suggestions for where taking samples, subsets or creating synthetic data may be appropriate at each stage in your pipeline development.
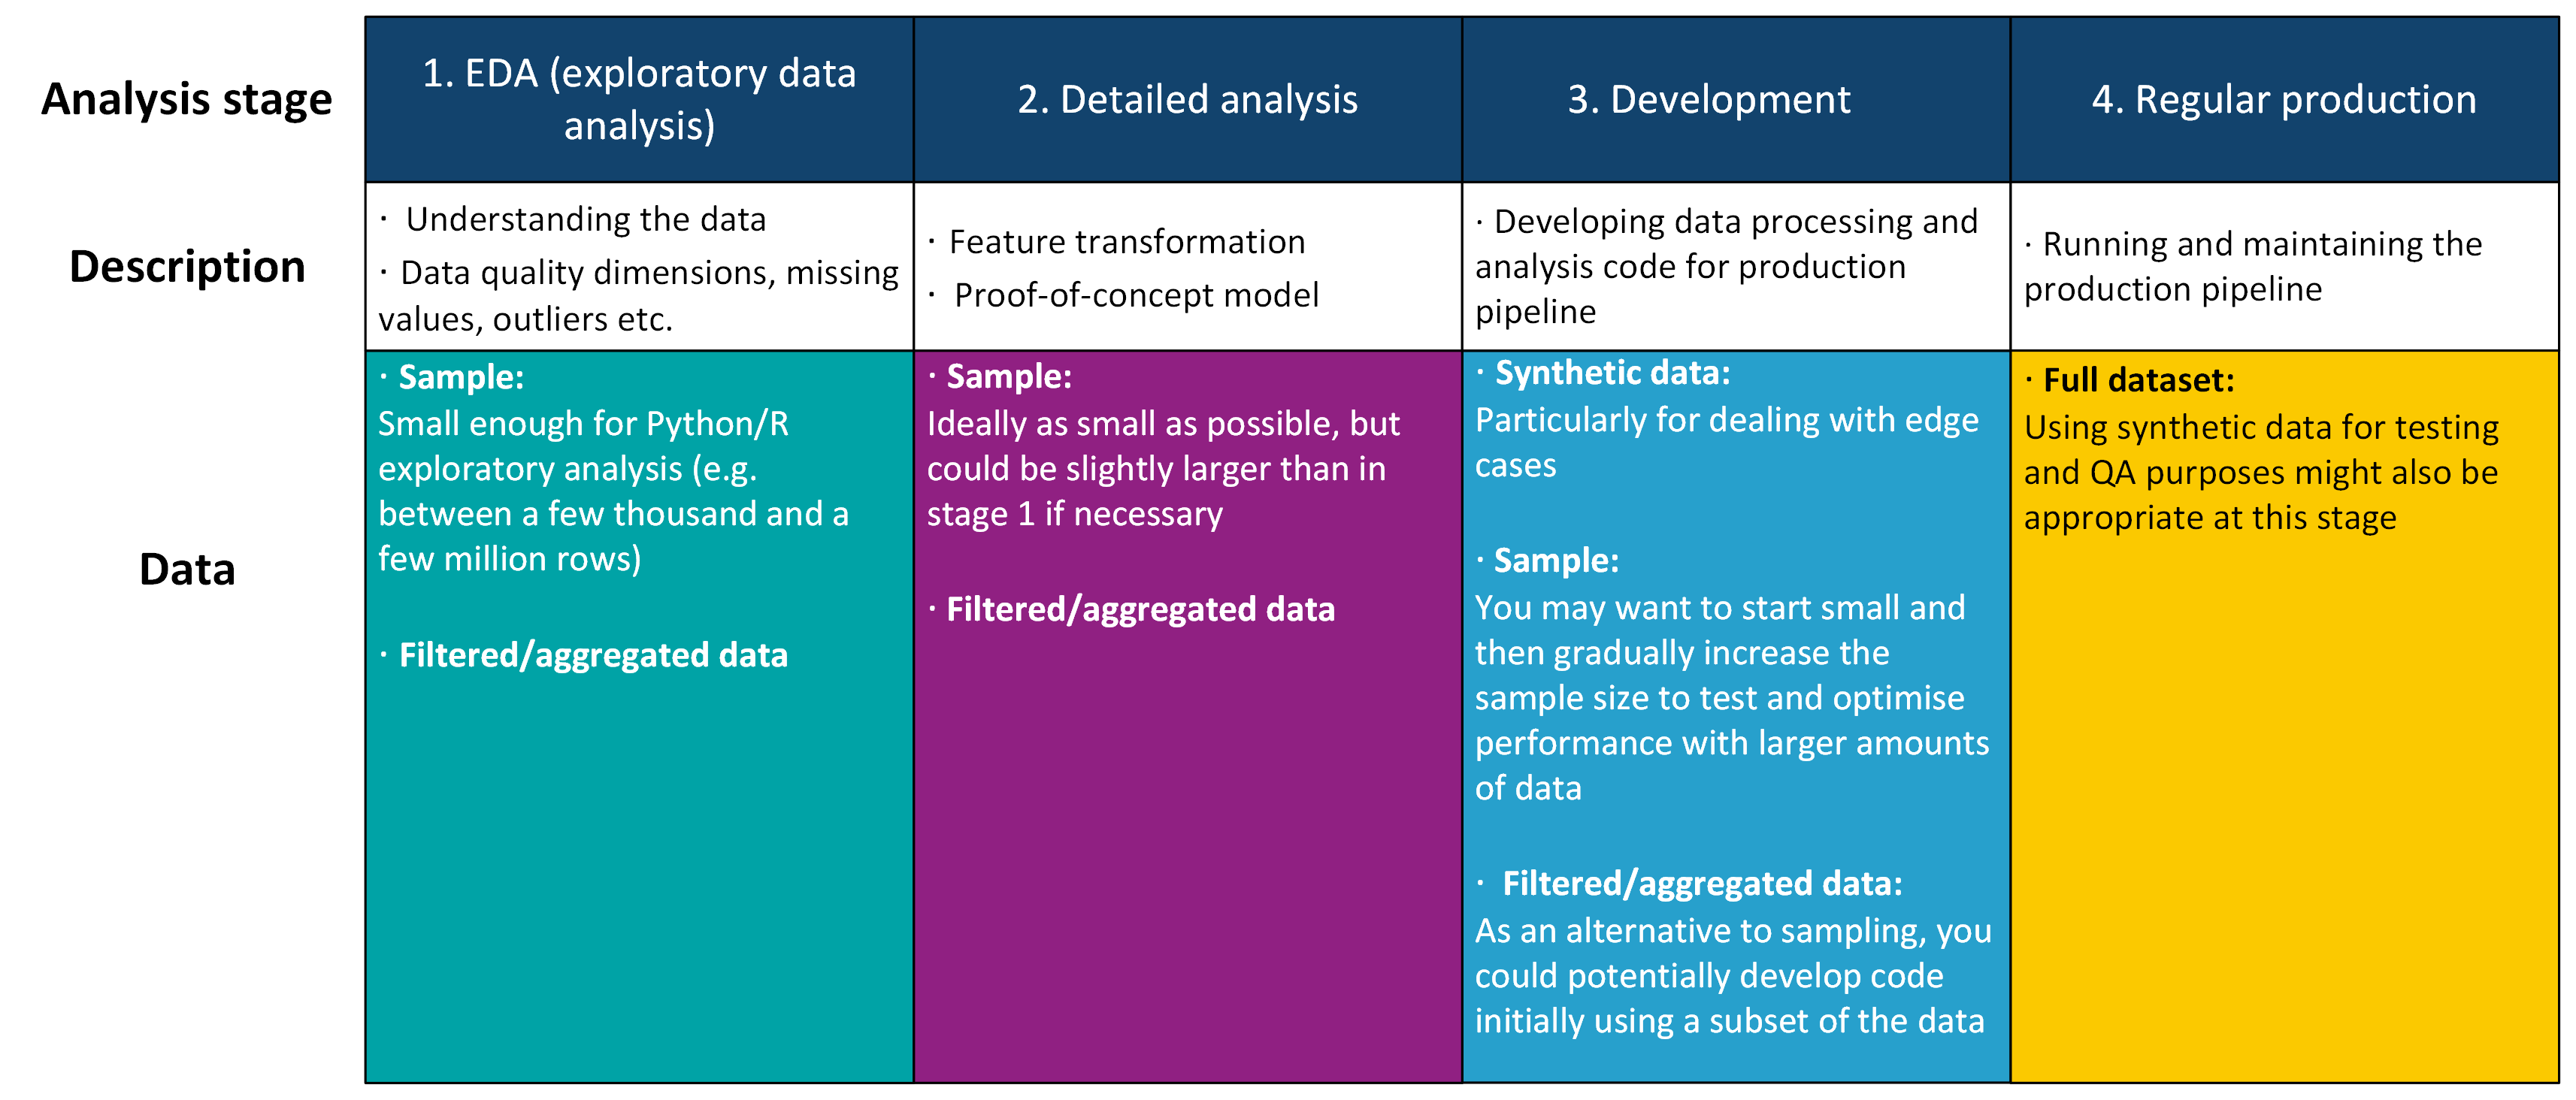
Fig. 41 Using samples/subsets or synthetic data in your pipeline development#
7. Ensure that duplicates are removed early on in the pipeline#
This can help reduce your data size early on.
Make sure your code does not create any duplicates e.g. when joining data sources together.
8. Use big data profiling tools to check data quality dimensions where possible#
PyDeequ or Great Expectations are useful profiling tools that can be used with PySpark.
We are not currently aware of any similar profiling packages that are compatible with SparklyR. As a result, if you are an R user, you will need to create code to examine your data quality dimensions yourself. We recommend that you consider the other tips in this guide to help minimise your resource use when doing so.
Spark optimisation#
The following section contains some more advanced suggestions you can consider applying to your pipeline to further optimise your code and minimise resource use. These are most likely to be useful in the ‘Development’ phase of working on your pipeline. Our general tips for Spark optimisation can be found on the Ideas for optimising Spark code page of the book.
9. Use Spark functions where possible#
Spark MLfunctions (MLlib) contain a range of tools for processing and analysing big data efficiently.You can also assemble
Spark MLoperations into an ML pipeline. These pipelines can be saved and reloaded later to re-run analysis or to apply analysis to a new set of data.See the Logistic regression page of this book for some examples of applying
Spark MLfunctions to a dataset and setting up aSpark MLanalysis pipeline.
10. Optimise joins#
Be aware of how the size of your data changes when joining other sources at various points in your pipeline.
Follow the guidance on the optimising joins page of this book.
11. Consider data partitioning#
Spark splits data into partitions to perform parallel processing.
Having too many or too few partitions may cause performance issues in your code.
There is no set rule for how many partitions your data should have. As a general guide, the optimum size for a partition is often suggested to be 100-200MB and the number of partitions should be a multiple of the number of nodes in your Spark session.
It may be beneficial to change how your data is partitioned at various points in your pipeline. For example if your full dataset contains 200 million rows, it may be reasonable to have 200 partitions. However, if later on in your pipeline this data is aggregated so that there are now only around 2 million rows, repartitioning your data on to a smaller number of partitions could improve performance and reduce the compute resource used.
Aim to make sure data is kept in roughly equal partition sizes throughout the pipeline.
This may also involve repartitioning your data at appropriate points due to skewed data
Identifying variables in your data that are skewed during the EDA phase of your pipeline development may help in avoiding or identifying this issue later in the development stage.
Be aware of the difference between narrow and wide transformations in Spark and how wide transformations can increase the number of partitions in your data.
If you are using Spark 2.X, you may need to repartition after performing such operations or consider changing the
spark.sql.shuffle.partitionsfrom the default (200) in your Spark config.If you are using Spark 3.X, ensure Adaptive Query Excution (AQE) is switched on by setting
spark.sql.adaptive.enabledtotruein your Spark config. This will automatically coalesce post-shuffle partitions.
12. Become familiar with the Spark UI#
The Spark UI is used to monitor the status and resource consumption of your Spark cluster and can be a useful tool for troubleshooting slow Spark code.
Check the size of the execution plan regularly
Do this either by examining the DAG (Directed Acyclic Graph) in the Spark UI or by using
df.explain()/explain(df)in PySpark/SparklyR.Overly long execution plans can cause performance issues.
Consider using checkpoints and staging tables at appropriate points in your code to break the lineage in these cases.
This is not an exhaustive list and not all of these tips will necessarily be applicable to every pipeline. But in general, having a good plan in place for your analysis, keeping data as small as possible during development, and improving your understanding of Spark can all help to minimise resource use when working with big data.